ModelX: A toolsuite for molecular modeling
ModelX is a toolsuite for biomolecular modeling inspired on the assumption that Molecular Biology conformational landscape is huge but limited, and also on the fact that interactions between biological entities can be decomposed into small structural motifs that are recycled and reused by nature while shaping new relationships. This assumption has been proved to be useful predicting dsDPi (double strand DNA-Protein interactions) and RPi (RNA-Protein interactions) and PPi[1] using naked protein structures (in PDB format) as input. ModelX modeling toolsuite uses fragment libraries as 3D puzzle pieces in order to recompose interaction conformational spaces. In other words, it is based on usage of fragment libraries as building blocks and developed to predict or reconstruct biomolecules and its interactions. The fragment libraries contain links between spatially close items as they are found in thousands of crystal structures creating in this way a collection of interacting pairs (intX) that are the key for the algorithms to generate docking models and statistical force fields for fast evaluation of the models generated.
RNAX (PROTEIN ASSISTED RNA ASSEMBLY -> RNA-PROTEIN Docking)
RnaX[2] is a new extension of the ModelX tool suite developed for the design of Protein–RNA interactions. RNA–protein complexes in the Protein Data Bank were decomposed into small peptide-oligonucleotide inter-acting fragment pairs and used as building blocks to assemble big scaffolds representing complex RNA-protein interactions. The design of RnaX relies on protein (pepX) and RNA (rnaX) fragments pairs (intX) standing for an interaction. This method has already been successful for designing DNA-protein and protein-protein interfaces. In this study, areas under the curve of up to 0.86 were achieved on binding site prediction, showing the accuracy and coverage of our approach over established and in-house benchmarking sets. Together with the latest (version 5) FoldX[3] protein design tool suite, we were able to engineer backbone- and side chain-compatible interfaces using naked protein structures as input.
PADA1 (PROTEIN ASSISTED DNA ASSEMBLY v1 -> DNA-PROTEIN Docking)
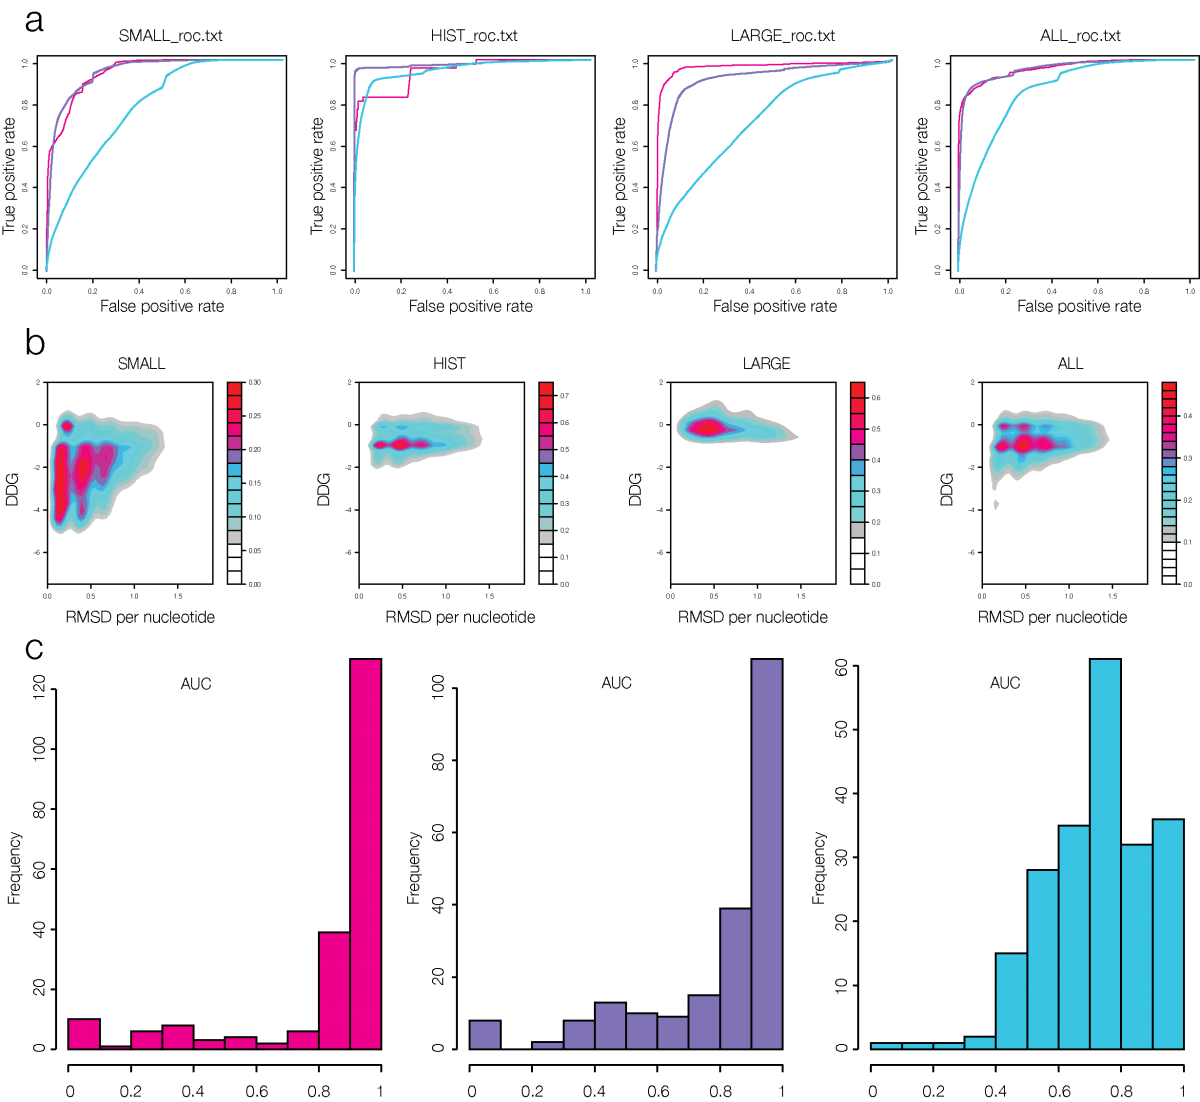
PADA1[4] (Protein Assisted Dna Assembly version 1) is an extension of the ModelX tool suite developed for the design of dsDPi interactions. The design of PADA1 relies on protein (pepX) and dsDNA (dnaX) fragments pairs (intX) standing for an interaction. PADA1 uses a training set of 2103 high quality DNA-Protein complexes extracted from the Protein Data Bank (PDB). It includes a fast statistical force field computed from the distances found in the training dataset (resolution smaller than 2.5Å) to quickly evaluate and filter the 3D docking models.
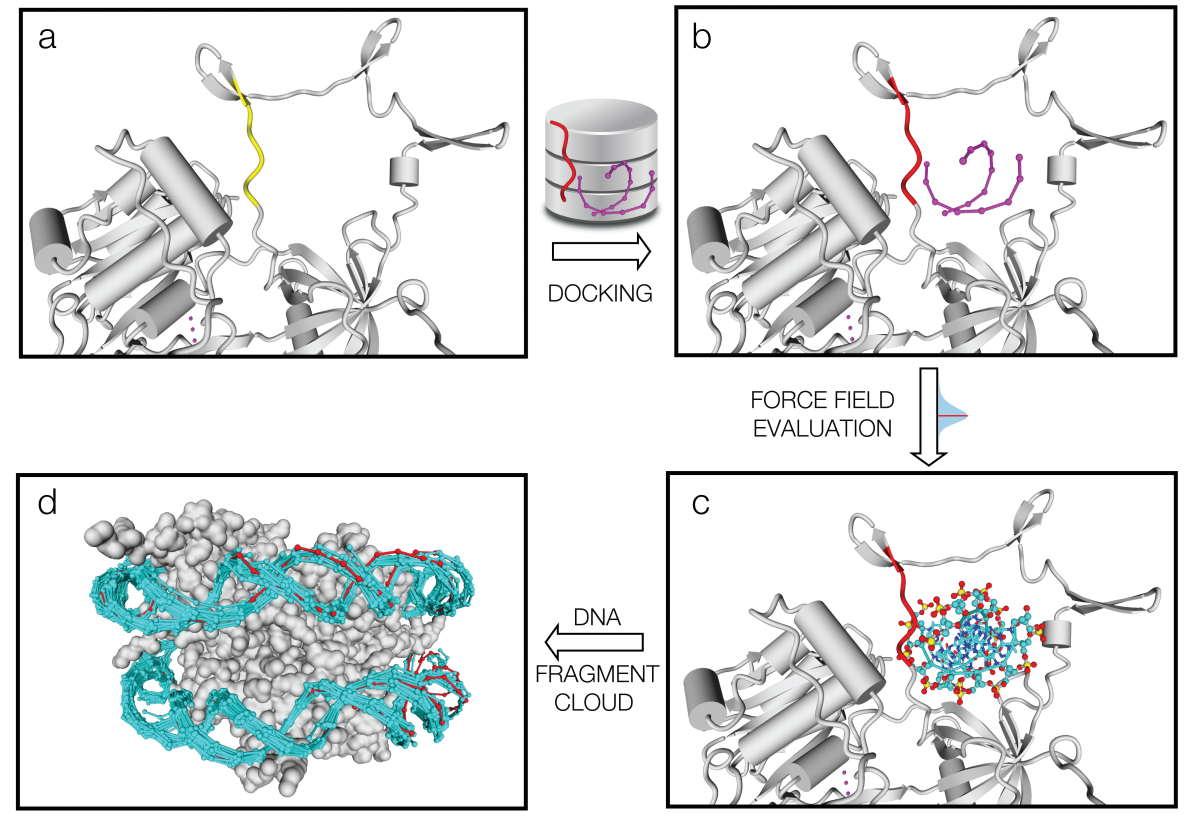
Out of 212 DNA-Protein structures (validation dataset) we predicted the DNA binding region with less than 1.8Å RMSD per residue in 209 cases (98%) and for the 3 remaining ones we also found the binding region for 2 of them using PADA1 exhaustive mode. The returned structural templates can be used by the PADA1 force field (low resolution) or by the protein design software FoldX (high resolution) to scan random DNA sequences. We show that the quality of the docked templates allows in the 80% of the cases to identify also the crystallized DNA molecule sequence. Also we illustrate how we could reconstitute dsDNA conformational changes upon protein mutagenesis using a meganuclease and its variants. Thus PADA1 can be used to discover DNA binding regions, dock dsDNA molecules, generate conformational diversity, and identify in combination with FoldX[5] the binding sequences.
PADA1 VALIDATION
References
- . ProteinFishing: a protein complex generator within the ModelX toolsuite. Bioinformatics. 2020 ;36(14):4208-4210.
- . Protein-assisted RNA fragment docking (RnaX) for modeling RNA-protein interactions using ModelX. Proc Natl Acad Sci U S A. 2019 .
- . FoldX 5.0: working with RNA, small molecules and a new graphical interface. Bioinformatics. 2019 ;35(20):4168-4169.
- . FoldX accurate structural protein-DNA binding prediction using PADA1 (Protein Assisted DNA Assembly 1). Nucleic Acids Res. 2018 .
- . The FoldX web server: an online force field. Nucleic Acids Res. 2005 ;33(Web Server issue):W382-8.